Graphs reference
Interactions
Evolution of all interactions
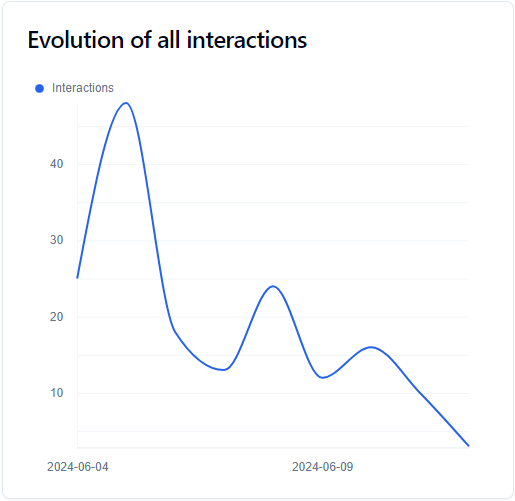
This graph gave you information about the evolution of received interactions over the selected time period. It uses all interaction types.
Most used interactions
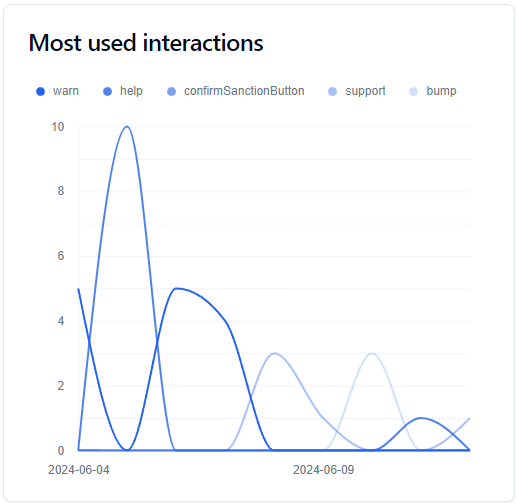
This graph shows you the 5 most received interactions (all types combined) over the last 30 days. To determine these 5 interactions, the website adds stats for the selected time period and picks the top 5.
Most received per type
These tree graphs show you the percentage of most received interactions, filtered per type (Commands, Components and Modals). To determine the 5 interactions, the website adds stats for the selected time period and picks the top 5.
Guilds
Evolution of guilds
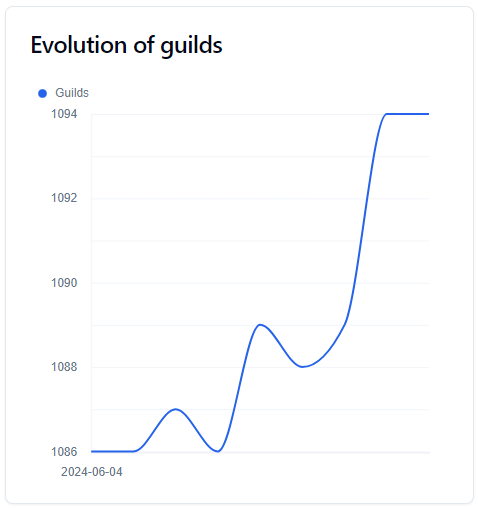
This graph shows the evolution of the number of servers over the selected time period.
Evolution of guilds' locales
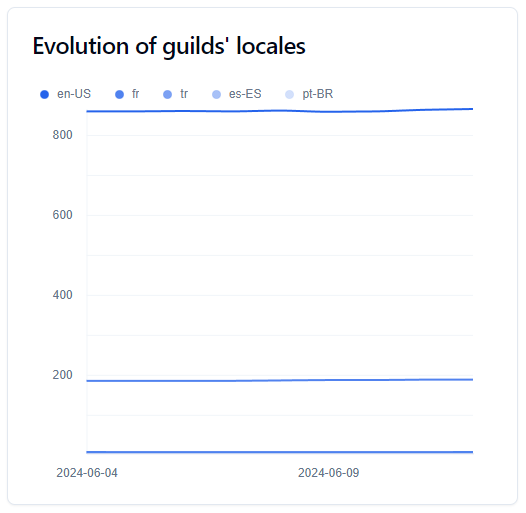
This graph allows you to see the evolution of the top 5 locales used by your bot's guilds.
To determine these 5 locales, the website adds the statistics from the selected time period and selects the top 5.
Distribution of guilds' locales
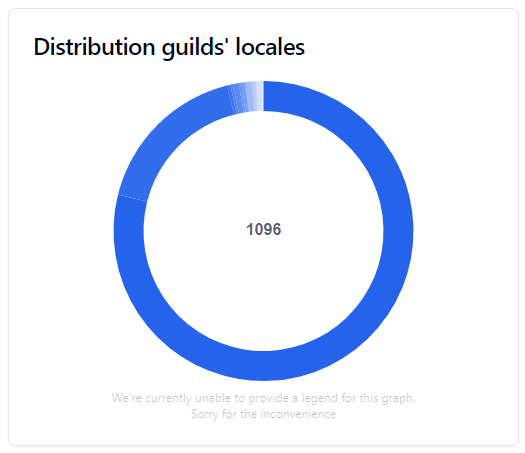
This pie chart allows you to see the percentage of your bot's guilds most used locales.
Distribution of guilds by size
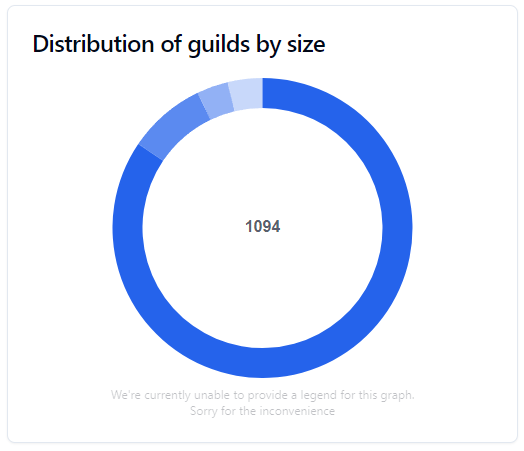
This graph allows you to see the size of the guilds that your bot is.
Additions and removals

This graph allows you to see how many times your bot has been added or removed from guilds.
Guilds Rankings
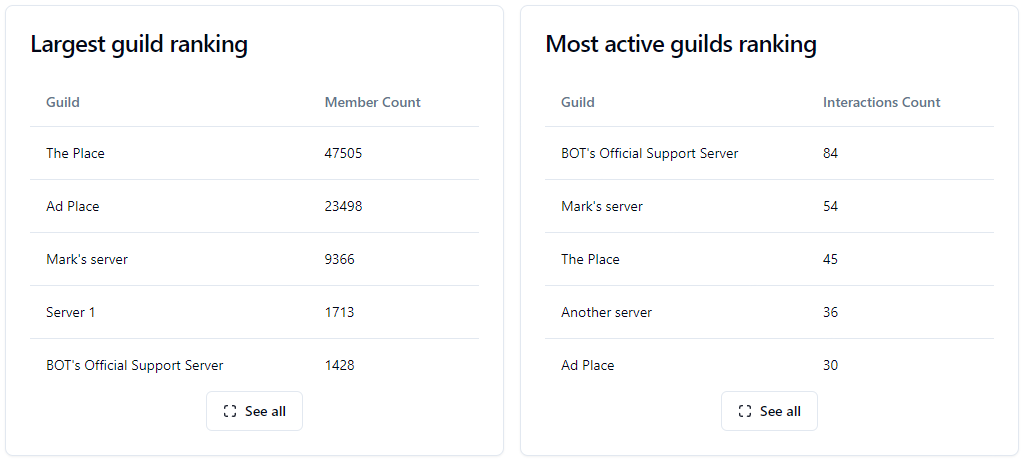
These rankings allow you to see which servers use your bot the most or those that have the most members.
WARNING
These data are only visible once advanced statistics are enabled!
Users
WARNING
All user stats are not accurate. It adds up all the members of all the guilds, so it can create duplicates, and it does not reflect the real active user count of your bot.
Evolution of users
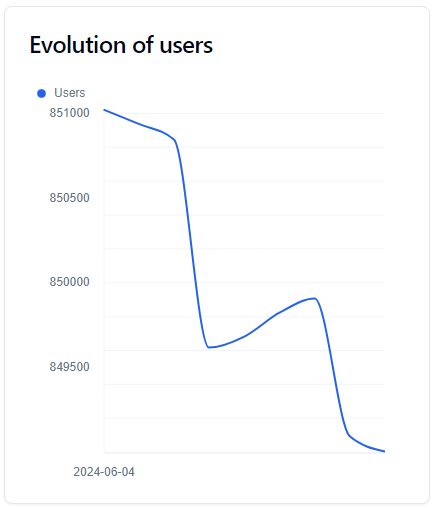
This graph gave you information about the evolution of users over the selected time period.
Evolution of users' locales
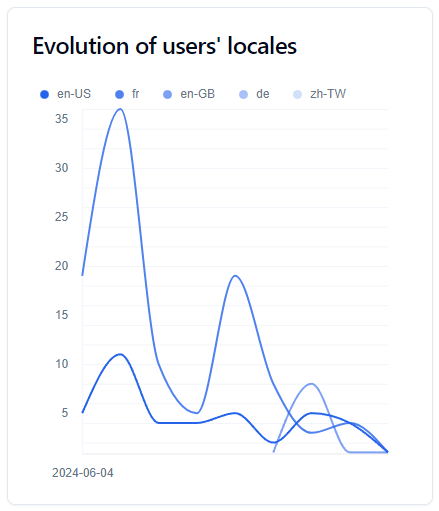
This graph allows you to see the evolution of the top 5 locales used by your bot's users. To determine these 5 locales, the website adds the statistics from the selected time period and selects the top 5.
Distribution of users' locales
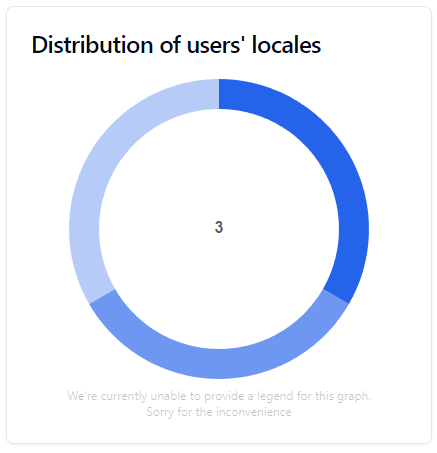
This pie chart allows you to see the number of your bot's users most used locales.
Distribution of activity over the week
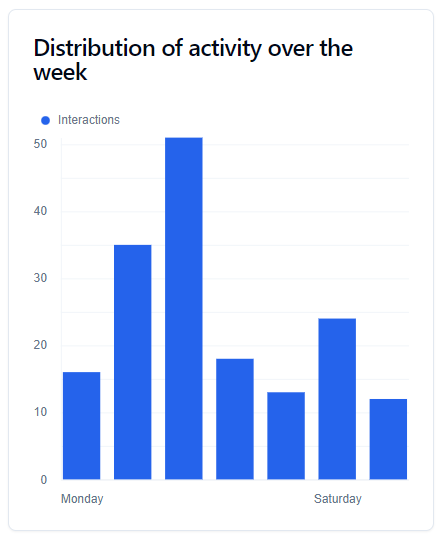
This graph allows you to see which days of the week your users are active. It combines all the data from the selected period to capture all interactions for a given day.
Type of users

This graph allows you to see what type of user is using your bot.
| Label | Description |
|---|---|
| Server Administrator | The user have at least one of the following permissions: Administrator, ManageGuild. |
| Server Moderator | The user have at least one of the following permissions: ManageMessages, KickMembers, BanMembers, MuteMembers, DeafenMembers, MoveMembers, ModerateMembers |
| New Member | The user joined the guild less than a week ago |
| Member | The user does not fall into any of the above categories. |
| DM User | The user executed the interaction in Direct Message |